

Businesses generate enormous amounts of data every day. Customer transactions, website visits, sales activity, marketing campaigns, financial records, inventory changes, employee information, and operational processes all create valuable data.
However, having data is not the same as knowing how to use it.
Business Intelligence (BI) and Analytics help organizations transform raw information into meaningful insights that can support better decisions. Instead of relying entirely on assumptions, businesses can use data to understand what is happening, why it is happening, what may happen next, and what actions could improve performance.
From small businesses tracking sales to large enterprises managing thousands of data sources, BI and analytics have become important components of modern business technology.
This guide explains what Business Intelligence and Analytics are, how they work together, the technologies behind them, common use cases, implementation strategies, challenges, and the future of data-driven decision-making.
What Is Business Intelligence?
Business Intelligence, commonly called BI, refers to the processes, technologies, tools, and practices used to collect, organize, analyze, and present business information.
The goal of BI is to help organizations understand their operations and make more informed decisions.
A typical BI system may bring together information from:
- Sales systems
- CRM platforms
- Websites
- E-commerce platforms
- Accounting software
- Marketing platforms
- Customer support systems
- Databases
- Spreadsheets
- Cloud applications
That information can then be transformed into reports, dashboards, charts, and other visualizations.
For example, a company could use BI to determine:
- Which products generate the most revenue
- Which marketing channels generate customers
- Which regions are growing fastest
- Which customers are most valuable
- Where operational costs are increasing
- Whether sales are meeting targets
What Is Business Analytics?
Business Analytics focuses on analyzing business data to discover patterns, trends, relationships, and potential outcomes.
Analytics can answer questions such as:
What happened?
Why did it happen?
What could happen next?
What should we do?
This makes analytics broader than simply creating reports.
For example, a sales dashboard might show that revenue declined during a particular month. Analytics can go further by examining customer behavior, product performance, marketing campaigns, pricing, and other variables to help identify potential causes.
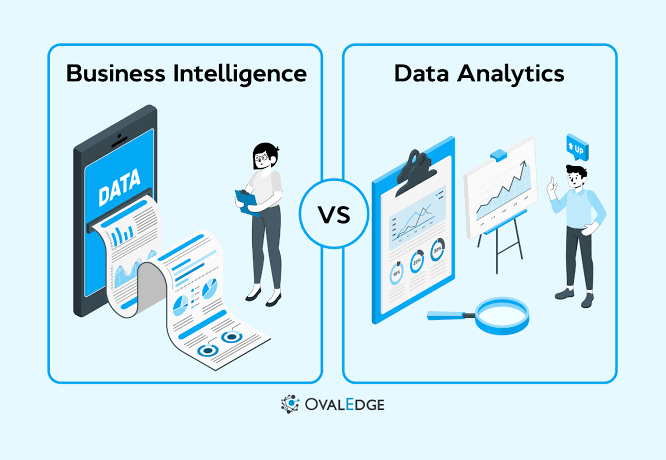
Business Intelligence vs Business Analytics
Although the terms are closely related, they are not identical.
Business Intelligence often focuses on understanding business performance through reporting, dashboards, metrics, and historical data.
Business Analytics focuses more heavily on analyzing data to identify patterns, explain outcomes, predict possibilities, and support decisions.
In practice, organizations often use both together.
A simplified process looks like:
Data → BI → Analytics → Insight → Decision → Action
The exact boundaries between BI and analytics can vary between organizations and technology providers, but the underlying objective remains the same: turning business data into useful information.
Why Business Intelligence & Analytics Matter
Modern businesses operate in increasingly data-rich environments.
Without an effective way to understand that information, important signals can easily be missed.
1. Better Decision-Making
Data can provide evidence that supports business decisions.
Instead of asking:
“Why are sales declining?”
a business can investigate specific metrics and trends.
2. Improved Operational Efficiency
BI can reveal inefficient processes.
For example, analytics might show that certain workflows take significantly longer than others.
3. Better Customer Understanding
Customer analytics can reveal:
- Buying behavior
- Product preferences
- Customer segments
- Retention patterns
- Support trends
- Customer lifetime value
4. Improved Financial Visibility
Businesses can analyze:
- Revenue
- Expenses
- Profit margins
- Cash flow
- Customer acquisition costs
- Product profitability
5. Faster Reporting
Automated dashboards can reduce the need for employees to manually compile reports from multiple spreadsheets.
6. Competitive Awareness
Organizations can use internal and external data to understand market changes and identify opportunities.
The Business Intelligence Process
A typical BI environment involves several stages.
1. Data Collection
Data is collected from various sources.
Examples include:
- CRM systems
- Websites
- Sales platforms
- Payment systems
- Accounting applications
- Customer service tools
- Marketing platforms
2. Data Integration
Data from different systems must be brought together.
This can be challenging because different applications may use different formats.
For example:
One system might identify a customer as:
Customer ID: 1045
while another uses:
Client Number: C-1045
Data integration helps connect information from these systems.
3. Data Cleaning
Raw data may contain:
- Duplicates
- Missing values
- Incorrect formats
- Inconsistent names
- Outdated information
Cleaning improves data quality.
4. Data Storage
Organizations often store structured business data in systems such as:
- Data warehouses
- Data lakes
- Databases
- Cloud storage platforms
5. Data Analysis
Analysts and BI tools examine the information to identify patterns and trends.
6. Data Visualization
Insights can be presented using:
- Dashboards
- Charts
- Graphs
- Tables
- Reports
- Maps
7. Decision-Making
Business leaders use the insights to make decisions.
The process then becomes:
Insight → Decision → Action → New Data
This creates an ongoing feedback loop.
The Four Types of Business Analytics
Business analytics is often divided into four major categories.
Descriptive Analytics
Descriptive analytics answers:
What happened?
Examples include:
- Monthly revenue
- Number of customers
- Website traffic
- Sales volume
- Product returns
This is usually the starting point for analytics.
Diagnostic Analytics
Diagnostic analytics asks:
Why did it happen?
For example, if sales declined, diagnostic analytics might examine:
- Product availability
- Pricing
- Marketing performance
- Customer behavior
- Geographic trends
Predictive Analytics
Predictive analytics asks:
What could happen next?
Organizations can use historical data and statistical or machine-learning models to estimate potential outcomes.
Examples include:
- Sales forecasting
- Demand forecasting
- Customer churn prediction
- Fraud detection
- Inventory forecasting
Predictions are estimates rather than guarantees, and their reliability depends on data quality, modeling methods, and changing conditions.
Prescriptive Analytics
Prescriptive analytics asks:
What actions could we consider?
It may evaluate different scenarios and help identify actions that could improve a desired outcome.
For example:
If inventory is expected to decline below a specific level, which replenishment strategy could reduce the risk of stockouts?
BI Dashboards and KPIs
Dashboards are one of the most visible parts of Business Intelligence.
A dashboard combines important metrics into a single interface.
A sales dashboard might include:
- Revenue
- Number of orders
- Conversion rate
- Average order value
- Customer acquisition cost
- Sales by region
- Sales by product
- Monthly growth
What Are KPIs?
Key Performance Indicators (KPIs) are measurements used to evaluate performance against a specific objective.
Examples include:
Sales KPIs
- Revenue
- Conversion rate
- Average order value
- Sales growth
Marketing KPIs
- Cost per lead
- Customer acquisition cost
- Conversion rate
- Return on advertising spend
Customer KPIs
- Retention rate
- Churn rate
- Customer lifetime value
- Customer satisfaction
Financial KPIs
- Gross margin
- Operating expenses
- Net profit
- Cash flow
The most useful KPI depends on the organization’s goals.
Data Visualization in Business Intelligence
Data visualization makes complex information easier to understand.
Common visualization types include:
- Bar charts
- Line charts
- Pie charts
- Scatter plots
- Maps
- Tables
- Heatmaps
- KPI cards
However, visualization should not be used simply for decoration.
The purpose of a chart is to make a meaningful pattern easier to identify.
For example, a line chart may be useful for showing revenue over time, while a bar chart may be more useful for comparing product categories.
BI Tools and Platforms
There are many categories of Business Intelligence tools.
Common capabilities include:
- Data visualization
- Dashboard creation
- Data modeling
- Reporting
- Data integration
- Automated reporting
- Self-service analytics
- Collaboration
Organizations may use cloud-based BI platforms, enterprise analytics systems, open-source technologies, or custom-built solutions.
The right choice depends on factors such as:
- Data sources
- Business size
- Budget
- Technical expertise
- Security requirements
- Reporting requirements
- Number of users
- Integration needs
Self-Service Business Intelligence
Traditional BI often required analysts or IT teams to create reports for business users.
Self-service BI gives employees more direct access to data and reporting tools.
A marketing manager, for example, may be able to create a campaign dashboard without waiting for a developer to build it.
Benefits can include:
- Faster analysis
- Greater flexibility
- Reduced reporting workload
- More employee participation in data analysis
However, self-service BI also requires appropriate governance.
Without clear standards, different departments may calculate the same metric in different ways.
Data Warehouses and BI
A data warehouse is a centralized system designed to store and organize data for reporting and analysis.
Organizations may bring information from multiple systems into the warehouse.
For example:
CRM + Website + E-commerce + Accounting + Marketing
↓
Data Warehouse
↓
BI Dashboard
This structure can provide a consistent source of information for analytics.
ETL and ELT
Data integration often involves processes known as ETL and ELT.
ETL
ETL means:
Extract → Transform → Load
Data is extracted from its source, transformed into the required format, and then loaded into a destination system.
ELT
ELT means:
Extract → Load → Transform
Data is loaded into the target environment first and transformed afterward.
Both approaches are used in modern data architectures.
The appropriate method depends on the organization’s systems, scale, and technical requirements.
Cloud Business Intelligence
Cloud computing has changed how organizations implement BI.
Cloud-based analytics can provide:
- Remote access
- Flexible scaling
- Easier collaboration
- Integration with cloud applications
- Reduced infrastructure requirements
Businesses can increasingly connect information from cloud-based SaaS platforms and analyze it through centralized BI environments.
However, cloud BI still requires attention to:
- Security
- Access controls
- Data governance
- Privacy
- Vendor dependency
- Compliance
Real-Time Analytics
Traditional BI often focuses on historical reporting.
Real-time analytics aims to provide information with minimal delay.
Potential use cases include:
- Fraud monitoring
- E-commerce activity
- Website behavior
- Manufacturing operations
- Logistics
- Financial transactions
- Security monitoring
For example, an e-commerce company might monitor transactions in near real time to identify unusual activity or changing demand.
Real-time analytics can be valuable, but not every business problem requires real-time data.
Artificial Intelligence and Business Analytics
Artificial intelligence and machine learning are increasingly connected with analytics.
AI can help with:
- Pattern recognition
- Forecasting
- Anomaly detection
- Classification
- Natural-language queries
- Automated insights
- Data preparation
- Recommendation systems
For example, an analytics platform might identify an unusual change in sales and automatically highlight the affected product category.
AI can make analytics more accessible, but organizations still need to verify results and understand the limitations of automated analysis.
Natural-Language Analytics
AI is also changing how users interact with BI platforms.
Instead of manually creating a complex query, a user may be able to ask:
“Show me sales growth by region for the last 12 months.”
The system can interpret the request and generate a visualization.
This can make data analysis more accessible to non-technical users.
However, natural-language analytics should still be governed carefully. Users need to understand how metrics are defined and where the underlying data comes from.
Business Intelligence for Small Businesses
BI is not limited to large corporations.
Small businesses can use relatively simple analytics systems to monitor:
- Sales
- Revenue
- Expenses
- Website traffic
- Marketing performance
- Customer behavior
- Inventory
A small business might begin with a spreadsheet-based reporting system and gradually move toward a dedicated BI platform as data volume and reporting requirements grow.
The important factor is not the size of the technology stack but whether it helps answer meaningful business questions.
BI for E-Commerce
E-commerce companies generate large amounts of data.
Useful analytics include:
Product Analytics
- Best-selling products
- Product returns
- Product margins
- Inventory levels
Customer Analytics
- Repeat purchases
- Customer lifetime value
- Customer segments
- Churn
Marketing Analytics
- Traffic sources
- Conversion rates
- Advertising performance
- Customer acquisition cost
Sales Analytics
- Revenue
- Average order value
- Sales by channel
- Sales trends
Combining these data sources can help businesses understand the entire customer journey.
Marketing Analytics
Marketing teams can use analytics to determine which activities are producing results.
For example:
Advertising → Website Visit → Lead → Customer
Analytics can help measure each stage.
Important measurements may include:
- Impressions
- Click-through rate
- Conversion rate
- Cost per lead
- Customer acquisition cost
- Revenue generated
- Return on advertising spend
This can help marketing teams allocate resources based on measurable performance.
Customer Analytics
Customer analytics focuses on understanding customers and their behavior.
Businesses can analyze:
- Purchase history
- Customer interactions
- Product preferences
- Support requests
- Engagement
- Retention
- Churn
One useful metric is Customer Lifetime Value (CLV).
CLV estimates the value a customer may generate over the relationship with a business.
When combined with customer acquisition costs, CLV can help organizations evaluate the economics of customer acquisition and retention.
Data Quality: The Foundation of Good Analytics
One of the biggest challenges in BI is poor-quality data.
Common problems include:
- Duplicate records
- Missing information
- Incorrect values
- Inconsistent formats
- Outdated records
- Conflicting definitions
For example, if one department records revenue before refunds while another records revenue after refunds, their reports may produce different results.
Good analytics therefore requires clear data definitions and quality controls.
Data Governance and Business Intelligence
Data governance establishes rules for how data is managed.
It can cover:
- Data ownership
- Data quality
- Access controls
- Security
- Privacy
- Retention
- Definitions
- Compliance
Governance becomes particularly important as organizations connect more systems and allow more employees to access analytics.
Privacy and Security in Analytics
Business intelligence systems can contain sensitive information.
Depending on the organization, this may include:
- Customer information
- Financial records
- Employee data
- Business strategies
- Transaction data
Organizations should apply appropriate security controls.
Important practices include:
- Role-based access
- Strong authentication
- Encryption
- Monitoring
- Data minimization
- Secure integrations
- Regular access reviews
Analytics should provide useful information without unnecessarily exposing sensitive data.
Common Business Intelligence Challenges
Poor Data Quality
Bad data can produce misleading results.
Data Silos
Information may be trapped inside separate systems.
Lack of Data Skills
Employees may have access to dashboards but not know how to interpret them.
Too Many Metrics
Tracking hundreds of KPIs can make it harder to identify what actually matters.
Poor Dashboard Design
A dashboard overloaded with charts can become difficult to use.
Lack of Governance
Different teams may create conflicting definitions and reports.
High Implementation Complexity
Large BI projects can involve significant technical and organizational work.
Common BI Mistakes
Building Dashboards Without Clear Goals
A dashboard should answer specific business questions.
Measuring Everything
More metrics do not automatically produce better decisions.
Ignoring Data Quality
A beautiful dashboard built on unreliable data is still unreliable.
Forgetting the End User
Reports should be designed around the people who actually use them.
Ignoring Security
Business data should not be unnecessarily exposed.
Focusing Only on Historical Reporting
Organizations can also use analytics to understand causes, identify patterns, and evaluate possible future outcomes.
How to Build a Business Intelligence Strategy
A successful BI strategy should begin with business objectives rather than technology.
Step 1: Define Business Goals
Determine what you want to improve.
Examples:
- Increase sales
- Reduce costs
- Improve customer retention
- Improve forecasting
- Reduce operational delays
Step 2: Identify Important Data
Determine which information is necessary to measure those goals.
Step 3: Audit Existing Systems
Identify where the data currently exists.
Step 4: Improve Data Quality
Clean and standardize important datasets.
Step 5: Choose the Right Architecture
Depending on your requirements, this may include databases, data warehouses, cloud platforms, and BI tools.
Step 6: Build Key Dashboards
Start with a small number of useful dashboards.
Step 7: Establish Governance
Define:
- Data ownership
- Metric definitions
- Access rules
- Security standards
Step 8: Train Users
Employees need to understand how to interpret and use analytics.
Step 9: Monitor and Improve
BI should evolve as business goals and data sources change.
How to Design an Effective BI Dashboard
A useful dashboard should answer important questions quickly.
Keep It Focused
Do not include every available metric.
Prioritize Important Information
Place the most important KPIs where users can find them quickly.
Use Appropriate Visualizations
Choose charts based on the type of information being presented.
Show Trends
Where useful, allow users to compare:
- Current vs previous period
- Actual vs target
- Region vs region
- Product vs product
Avoid Visual Clutter
Too many colors, charts, filters, and tables can make a dashboard difficult to understand.
Business Intelligence and ROI
Organizations often want to know whether a BI investment is worth the cost.
Potential benefits can include:
- Reduced manual reporting
- Better resource allocation
- Improved sales performance
- Reduced operational costs
- Faster decisions
- Better customer retention
- Improved forecasting
ROI should be evaluated against the specific business objectives the BI project is designed to support.
For example, if automated reporting saves employees many hours every month, that efficiency can be measured.
The Future of Business Intelligence & Analytics
BI is evolving from static reporting toward more intelligent and interactive analytics.
Several developments are particularly important.
AI-Powered Analytics
AI can help identify patterns and generate insights automatically.
Predictive Analytics
Organizations are increasingly using historical data to estimate future outcomes.
Natural-Language Interfaces
Users can increasingly interact with data using everyday language.
Automated Insights
Analytics systems can highlight unusual changes without requiring users to search through every dashboard.
Real-Time Decision Support
More organizations are using continuously updated information for operational decisions.
Embedded Analytics
Analytics can be integrated directly into business applications rather than existing as a separate destination.
More Accessible Analytics
AI-assisted tools may allow employees without advanced technical skills to explore business data more easily.
How Businesses Can Prepare for the Future of Analytics
Organizations can prepare by focusing on several fundamentals.
Improve Data Quality
AI and analytics are only as reliable as the information they use.
Create Clear Data Governance
Establish consistent definitions, ownership, access rules, and security practices.
Train Employees
Data literacy will become increasingly important across departments.
Start With Business Problems
Do not adopt analytics technology simply because it is popular.
Combine Human Judgment With Technology
Analytics can provide evidence and recommendations, but important business decisions may still require human context and judgment.
Final Thoughts
Business Intelligence and Analytics provide organizations with a framework for turning data into useful business information.
From dashboards and KPIs to predictive analytics, AI-powered insights, data warehouses, and real-time reporting, modern BI technologies can support decisions across sales, marketing, finance, operations, customer service, and leadership.
However, successful analytics is not simply about purchasing a BI platform.
Businesses also need reliable data, clear objectives, appropriate governance, secure systems, useful dashboards, and employees who understand how to interpret information.
The most effective BI strategy starts with a simple question:
What business decision are we trying to improve?
Once that question is clear, organizations can determine which data, analytics methods, and technologies are actually needed.
Frequently Asked Questions
What is Business Intelligence?
Business Intelligence is the use of technologies, processes, and practices to collect, analyze, visualize, and present business information to support decision-making.
What is Business Analytics?
Business Analytics involves analyzing business data to understand performance, identify patterns, explain outcomes, estimate potential future results, and support decisions.
What is the difference between BI and analytics?
BI often focuses on reporting and understanding business performance, while analytics goes further into diagnosing causes, forecasting potential outcomes, and evaluating possible actions. The two are frequently used together.
What are the four types of business analytics?
The four commonly discussed types are descriptive, diagnostic, predictive, and prescriptive analytics.
What is a BI dashboard?
A BI dashboard is a visual interface that displays important business metrics, KPIs, trends, and other information in a centralized format.
What are KPIs?
Key Performance Indicators are measurable values used to track progress toward specific business objectives.
Can small businesses use Business Intelligence?
Yes. Small businesses can use BI for sales reporting, financial analysis, marketing performance, customer analytics, inventory management, and other areas.
Does BI require a data warehouse?
Not always. The appropriate architecture depends on the organization’s size, data volume, reporting needs, and technical requirements. A data warehouse can be useful for consolidating data from multiple sources.
How does AI affect Business Intelligence?
AI can support analytics through automated insights, anomaly detection, forecasting, natural-language queries, classification, and pattern recognition.
Is Business Intelligence secure?
BI can be secure when appropriate controls are implemented. Organizations should consider authentication, authorization, encryption, data governance, privacy, monitoring, and secure integrations.